
Landsat for Mangroves: How EO Can Track Coastal Waters
Abigail Barenblitt holds a BS in Environmental Science and Policy from University of Maryland and an MS in Wildlife and Fisheries Science from Penn State University. She participated in NASA’s DEVELOP program for two terms and has served as a data analyst in the Biospheric Sciences Lab since 2019.
Her research focuses include the remote sensing of landcover change and anthropogenic activity as well as scientific communication using Google Earth Engine apps.
The topic of nature-based solutions for climate change has received increasing attention in recent years as a way to address not only climate change, but other impacts on our natural world, such as deforestation and biodiversity loss. A prime example of such a solution is the monitoring of landcover changes, particularly in mangroves. Mangroves, trees that grow in coastal waters, provide numerous ecosystem services that address numerous parts of the UN’s Sustainable Development Goals, serving as storm buffers, nurseries for fish species, and carbon sinks. Numerous tropical regions, like Guinea, are interested in monitoring current mangrove extent to not only protect their current coastlines, but also to explore regions for restoration to better improve natural resilience to sea level rise and storm surges. For this project, we partnered with the World Bank to produce a Land Use Landcover Change Map for Guinea from 2000-2020.
Landsat, with its long-running data catalog dating back to the 1970s, has been critical for monitoring dynamics landscapes like mangroves. Landsat collects data over the entire surface of the earth every 16 days, providing us insight into how mangroves are being lost, and where that loss happens. Even in cloudy regions like the tropics, the wealth of Landsat data available allows us to stitch together the best available images to gain a clear picture of Guinea. Our work has traveled back in time to the year 2000 to generate landcover maps at several time stamps. When we overlay these images, we can see where mangroves are lost, and what is driving that loss. From this work, we found a drastic loss of mangroves between 2000-2005 (>2,000 Km^2), but then gains in every subsequent time period.
From this landcover mapping, we are able to visualize future possible sea-level rise scenarios with or without mangroves. These visualizations provide country-wide information on mangrove extent and change to detail where regions are most threatened by natural disasters and where mangroves have been lost. While satellite data has its limits, this has helped land managers on the ground in Guinea understand where restoration efforts could be prioritized to improve coastline stabilization. In regions of historical mangrove presence, conservation managers can identify if land is restorable based on saline levels and level of urbanization impacting an area. These maps also demonstrate where mangrove growth has occurred, allowing managers to study the patterns that may have contributed to successful restoration. The use of mangroves and other nature-based solutions can take a mammoth effort when it comes to studying regions at large. But with the use of satellite data like Landsat, we have been able to shine a light on the tropics and point to patterns that could help us battle natural disasters.
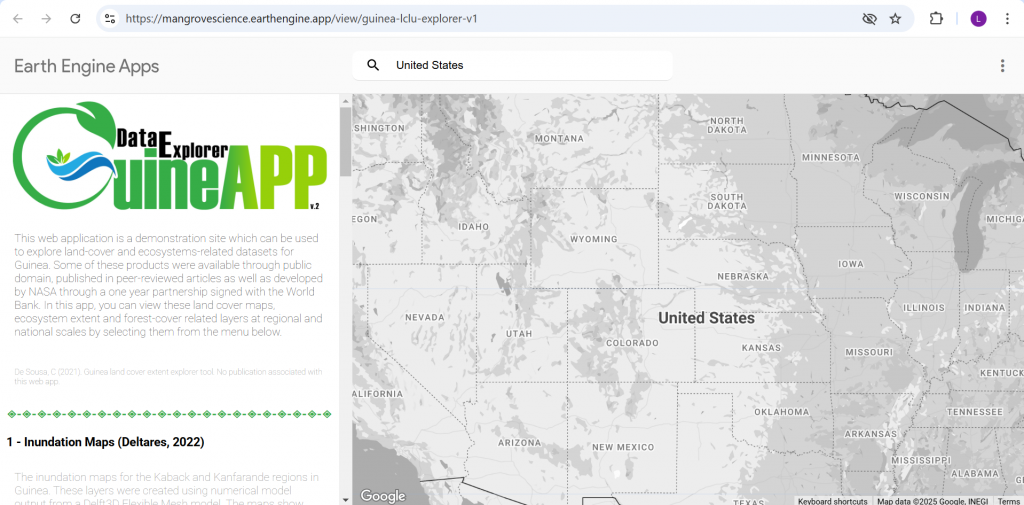
To explore our results, please check out our app: https://mangrovescience.earthengine.app/view/guinea-lclu-explorer-v1
Date Published: February 10th, 2025


